Ask GRAI Anything
Your Real Estate Questions, Answered Instantly via Chat

Help us make GRAI even better by sharing your feature requests.

Dataset: GRAI dataset 2026-09-05-v1 | US DOL OFLC | Apr 1-Jun 30, 2025 and 2026
Will H-1B visa changes affect home prices? Possibly, but probably not through the mechanism most people expect.
The simple version of the argument is that fewer H-1B workers means fewer homebuyers, which means lower prices. Housing markets rarely move that neatly. A visa or employment-policy change first has to change real household decisions, and those decisions have to be large enough and concentrated enough to affect a local market.
For an owner-occupier, a job loss can trigger several choices at once. A household may look for another employer, move to another US city, leave the country, sell sooner than planned, or keep the property and rent it out. At the same time, fewer new hires into the same employment market can weaken the flow of replacement households with similar purchasing power.
None of those outcomes is automatic. If enough of them happen in the same place, however, an employment shock can start to show up in inventory, buyer demand, rents or seller concessions.
GRAI's earlier analysis of Department of Labor filing data found that employer-declared new-employment positions fell 7.5% nationally between April-June 2025 and April-June 2026, and 33.4% across a six-city Dallas-Fort Worth corridor. That article focused on what job loss could mean for someone who already owns a US home, including the choice between selling, renting and holding. Read the earlier H-1B homeowner analysis
The question this time is broader. Was DFW an unusual case, or was it part of a wider national shift?
To answer that, GRAI expanded the analysis to every US city-state market with at least 250 employer-declared H-1B new-employment positions in the April-June 2025 baseline period. That produced 89 markets covering 92,993 positions, or 56.9% of the national baseline. The 2026 result played no part in deciding which markets were included.
The national picture was much more divided than the 7.5% headline decline suggests. Of the 89 qualifying markets, 75 recorded fewer new-employment positions and 14 recorded more, which means the national figure is combining very different local employment stories.
Several large technology markets moved strongly upward. San Francisco rose 86.7%, San Jose 58.7%, Mountain View 66.7%, Seattle 26.8% and Bellevue 15.0%. San Diego produced the biggest increase of all, rising from 893 to 2,932 positions, or 228.3%.
San Diego is also a useful warning against reading a large percentage as a citywide employment boom. GRAI's employer-concentration check found that just over half of San Diego's 2026 requested new-employment positions came from its largest employer. A dramatic city result can therefore reflect both broader hiring conditions and the filing decisions of a relatively small number of large companies.
The declines show the same need for context. Edison, New Jersey fell from 479 to 179 positions, a 62.6% decline, while Raleigh fell from 740 to 355, or 52.0%. Those are meaningful employment-filing signals, but their relatively modest starting bases should remain visible whenever the percentages are quoted.
What emerges from the 89-market comparison is not a simple story of H-1B employment falling everywhere. It looks more like a redistribution of intended hiring activity across local markets, with strong expansion in some places and unusually sharp contraction in others.
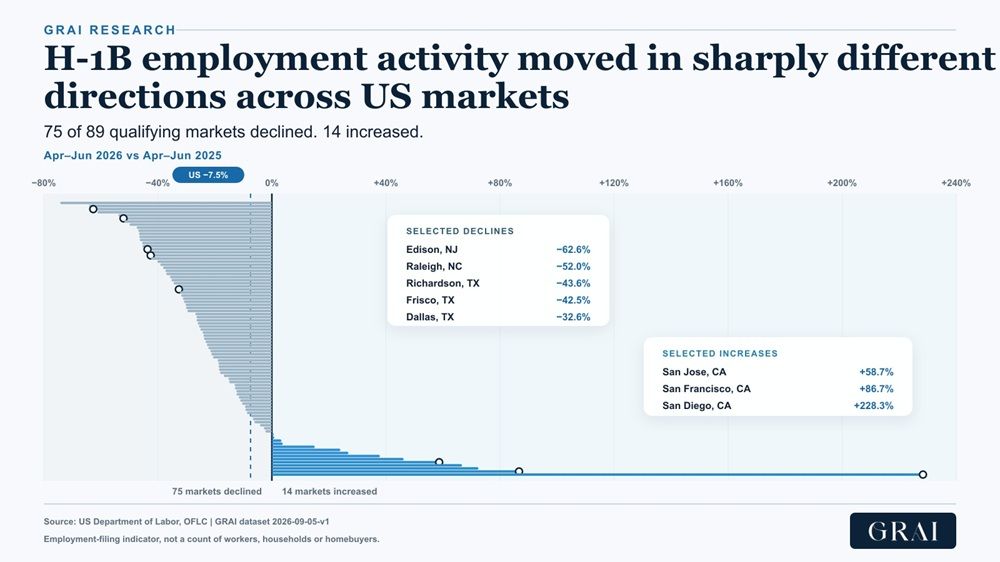
Year-over-year change in employer-declared H-1B new-employment positions across the 89 US city markets meeting GRAI's inclusion threshold, April–June 2026 versus April–June 2025. Seventy-five declined and 14 increased, against a national change of −7.5%. An employment-filing indicator, not a count of workers, households or homebuyers. Source: US Department of Labor, OFLC · GRAI dataset 2026-09-05-v1.
Explore all 89 qualifying US markets in the GRAI research dashboard
An LCA is an employer filing, so one obvious objection is that the results may simply capture changes in filing behaviour rather than changes in intended hiring. Looking at filings and requested positions side by side helps test that explanation.
| Market | New-employment positions | Certified filings |
|---|---|---|
| San Francisco, CA | +86.7% | +26.7% |
| San Jose, CA | +58.7% | -2.1% |
| Irving, TX | -31.8% | about -19.2% |
| Raleigh, NC | -52.0% | -13.6% |
| Edison, NJ | -62.6% | -39.9% |
San Jose is a particularly useful example. Employers filed slightly fewer certified LCAs while requesting almost 59% more new-employment positions. Raleigh moved in the opposite direction, with filings down about 14% while requested headcount fell by more than half.
The same pattern appears at the DFW aggregate level. Certified H-1B filings fell from 14,249 to 11,592, or about 18.6%, while employer-declared new-employment positions fell from 9,975 to 6,646, or 33.4%.
This does not turn LCA data into a count of completed hires or arriving workers. It does, however, make it harder to dismiss the movement as employers simply filing fewer forms. In many markets, employers were asking for materially different numbers of workers per filing.
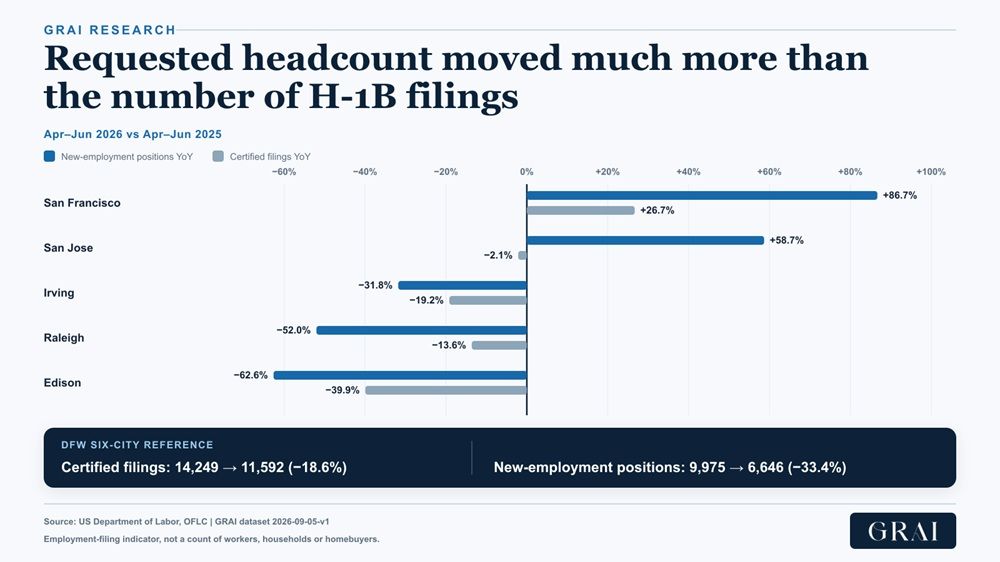
Certified LCA filings and employer-declared new-employment positions moved by very different magnitudes. In San Jose employers filed 2.1% fewer LCAs while requesting 58.7% more workers; across the DFW six-city corridor filings fell 18.6% while requested positions fell 33.4%. April–June 2026 versus April–June 2025. Source: US Department of Labor, OFLC · GRAI dataset 2026-09-05-v1.
The final normalized dataset puts the six-city DFW corridor at 9,975 new-employment positions in April-June 2025 and 6,646 one year later. Nationally, the comparable totals were 163,567 and 151,334, which means DFW's share of national new-employment activity fell from about 6.1% to 4.4%.
The weakness was spread across all six cities in the predefined corridor. Richardson fell 43.6%, Frisco 42.5%, Dallas 32.6%, Irving 31.8%, McKinney 30.8% and Plano 26.4%. The earlier GRAI article contains the city-level table and the homeowner implications, so there is little value in reproducing that full table here.
There is an important worksite caveat to keep beside those numbers. The share of DFW filings covering multiple worksites increased materially between the two comparison periods, while the city analysis assigns activity to the first worksite recorded in the main DOL disclosure file. Some city-level movement may therefore reflect attribution drift as well as a real change in intended employment.
Using a six-city corridor reduces some of that noise when a worksite shifts between those six cities, but it cannot remove the issue entirely. DFW should therefore be read as a strong employment-filing signal, not as a precise count of workers physically located in North Texas.
The most visible H-1B policy intervention over the past year was the $100,000 payment requirement introduced by Presidential Proclamation 10973. That payment is not currently enforceable. On June 8, 2026, the US District Court for the District of Massachusetts vacated the federal policy implementing it, and the First Circuit denied the government's request to stay that ruling on July 24. USCIS now says it will comply with the court order while the appeal continues. (1)
There is still a conflicting legal track. A federal district court in Washington, D.C. upheld the proclamation in December 2025, and the Chamber of Commerce's appeal is pending before the D.C. Circuit. That leaves two different district-court readings of presidential authority while appellate litigation continues. (2)
The proclamation also carries its own clock. Its effective date was 12:01 a.m. EDT on September 21, 2025, and its text says the restriction expires 12 months later unless extended. On that language, the current restriction lapses at 12:01 a.m. EDT on September 21, 2026 unless the administration extends or replaces it.
DHS has already proposed a different route. A proposed rule published on August 25 would establish an additional $103,265 fee for cap-subject H-1B petitions, including advanced-degree cap cases. Unlike the proclamation's outside-the-US focus, the proposed rule would also reach cap-subject change-of-status petitions filed for people already in the United States, including some F-1-to-H-1B cases. It is not effective law, and comments close on September 24, 2026. (3)
The H-1B selection process has changed as well. The weighted cap-selection system took effect on February 27, 2026, giving progressively greater selection weight to higher wage levels. Level IV registrations receive greater weight than Level III, Level II and Level I registrations. (4)
For households already in the United States, the current post-employment rule at 8 CFR 214.1(l) still provides up to 60 consecutive days after qualifying employment ends, or until the authorized validity period expires if sooner. DHS retains discretion to shorten or eliminate that period in an individual case. A proposed rule titled Eliminating the Discretionary 60-day Grace Period completed OIRA review on August 27, but it remains a proposed rule. (5)
DHS has also placed removal of employment-authorization eligibility for certain H-4 spouses on its long-term regulatory agenda. That proposal is not current law, but it remains relevant to housing resilience for households that depend on two incomes.
DOL is changing another part of the system that affects this research directly. A proposed rule published in March would revise the methodology used to establish the four prevailing-wage levels used in H-1B and related programs. The proposal would change how the wage levels themselves are defined, so future Level I-IV comparisons may not be perfectly continuous with today's series if the rule is finalized. (6)
The composition of requested new-employment positions shifted toward higher wage levels even before we consider whether a city was growing or shrinking. Among positions with a valid Level I-IV wage level, the Level I/II share fell nationally from 81.1% to 69.6%. In DFW it fell from 86.1% to 76.1%.
The same direction appears in markets with very different employment outcomes. San Francisco grew sharply, yet its Level I/II share fell from 71.1% to 53.0%. San Jose grew 58.7% while its Level I/II share fell from 69.8% to 63.9%.
Declining markets show a similar pattern. Raleigh fell from 83.2% to 60.6%, Edison from 97.7% to 79.7%, and Irving from 89.1% to 74.7%. The wage shift is therefore not simply a by-product of weaker hiring.
Several forces can be operating at once, including employer mix, occupation mix, wage policy and the new weighted selection process. The data does not support assigning the entire movement to one rule, and DOL's proposed prevailing-wage methodology gives us another reason to avoid that causal leap.
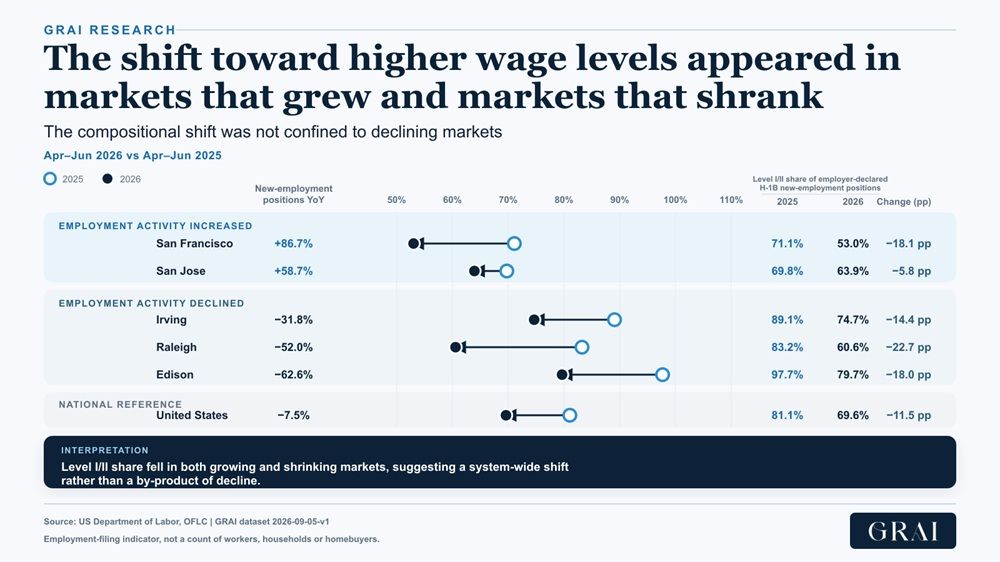
The Level I/II share - the lower two of the four DOL wage tiers - fell in every market shown, including San Francisco and San Jose, where total new-employment positions rose 86.7% and 58.7% respectively. April–June 2026 versus April–June 2025. Source: US Department of Labor, OFLC · GRAI dataset 2026-09-05-v1.
It does, particularly in DFW. About 61% of DFW's 2025 new-employment positions were associated with employers in NAICS 5415, Computer Systems Design and Related Services. The national share was about 29%. By 2026 the corresponding shares were roughly 47% in DFW and 22% nationally.
That suggests DFW's H-1B activity was more concentrated in one broad technology-services industry than the national market. Two cities with the same number of filings can therefore behave very differently if one has a diversified employer base and the other relies more heavily on a narrower set of companies or industries.
The H-1B-dependent employer measure adds another piece of context. H-1B-dependent employers accounted for about 24.2% of certified national filings in 2025 and 20.7% in 2026. In the DFW corridor the shares were about 41.1% and 38.9%.
Those figures are shares of certified filings, not positions. “H-1B-dependent” is also a statutory classification, not a synonym for a staffing, consulting or outsourcing company.
Use GRAI to map H-1B employer concentration against local housing risk in your city: https://internationalreal.estate/chat
The first housing effect may not come from missing first-time buyers. It may begin with households that already own homes.
A household facing job loss or relocation still has a mortgage, property tax, insurance, HOA charges and maintenance costs. If the worker finds another qualifying employer locally, the housing effect may be small. If the household moves to another US market, the property may be sold or rented. If the household leaves the country, the same sell-versus-rent decision becomes more complicated because of management, tax and timing issues.
This is where the seller side becomes important. An owner who expected to hold a home for another five years may list it earlier than planned, while another may keep the home and add it to rental supply. A third may wait several months while searching for another job before deciding.
Those outcomes would show up in different parts of the housing market. More sales could increase resale inventory, while more rental conversions could add rental supply instead. Successful local re-employment could stop the transmission before housing responds at all.
Buyer demand is the other half. If fewer high-income households enter a market while more existing households leave, the effect can become larger. If another group of households with similar purchasing power arrives at the same time, the pressure may disappear.
The crucial real-estate variable is therefore replacement demand. Prices respond to the balance between households leaving, households arriving and the stock of homes available to them, not to a visa statistic in isolation.
The DOL data is best treated as an early employment indicator. To argue that it is becoming a housing-market event, several property measures would need to move in the same local market.
Active listings would show whether more owners are putting homes up for sale. Days on market and price reductions would show whether buyers are absorbing those listings more slowly, while pending sales, mortgage purchase activity and sale-to-list ratios would help separate weaker demand from a simple increase in supply.
Rental data deserves equal attention. If departing owners keep their homes, the first visible effect might be more rental inventory, longer vacancy periods or greater concessions rather than falling resale values.
The most useful analysis will be local. A weakening employment signal in Frisco does not prove that a particular subdivision is under pressure, just as a strong San Jose LCA result does not prove that every neighbourhood is seeing stronger housing demand.
The policy calendar also deserves monitoring. The next DOL OFLC disclosure release, any extension or replacement of Proclamation 10973, appellate rulings on the $100,000 policy, the proposed $103,265 fee, the 60-day grace-period proposal and the DOL prevailing-wage rule could all change how the employment data should be read.
An LCA is an employer filing, not an approved H-1B petition, completed hire, worker arrival, resident, household or homebuyer. One filing can cover several positions and several worksites, which is why the dashboard describes these numbers as employment-filing indicators rather than worker counts.
The city field in the main DOL disclosure file represents the first worksite associated with the case. The separate Worksites file can help diagnose multi-worksite cases, but GRAI did not use it to redistribute new-employment positions because the FY2026 Worksites release covered only about three-quarters of the relevant parent filings and does not allocate employment-action categories by worksite.
Employer concentration creates another limit. Redwood Shores recorded a 74.2% decline, but almost all of its 2025 new-employment activity came from one employer. San Diego recorded the largest increase in the 89-market universe, yet its largest employer accounted for just over half of 2026 requested positions. Extreme city results can therefore be genuine while still being heavily influenced by a small number of firms.
There is also a timing issue in administrative datasets. DOL records can change after later withdrawals or redeterminations. GRAI uses the current-status Certified population in the specified comparison releases and treats later-status changes as a sensitivity rather than quietly mixing different cohort definitions.
Finally, the wage-level series itself may change if DOL finalizes its proposed prevailing-wage methodology. Future comparisons should disclose any break in definitions rather than present the series as unchanged.
The evidence today does not support saying that H-1B policy changes are already lowering US home prices. It supports a more useful conclusion: employer-declared H-1B new-employment activity weakened nationally, weakened much more sharply in DFW, and moved in very different directions across the 89 qualifying markets.
Those differences create plausible housing transmission channels where employment pressure is concentrated, household incomes are exposed and replacement demand is weak. They do not prove that the transmission has already happened.
For homeowners, investors and agents, the useful question is not whether an immigration headline sounds bullish or bearish for real estate. It is whether local employment conditions are changing household behaviour, and whether inventory, demand, pricing or rental data is beginning to confirm it.
GRAI will continue to track the employment side of that chain as new DOL releases arrive.
Readers can inspect the complete market data rather than relying on the examples selected in this article.
Explore the full 89-market GRAI research dashboard
A city-level employment signal is not enough to decide whether to buy, sell, rent or hold a specific home. Mortgage terms, equity, achievable rent, transaction costs, taxes, insurance and the likely length of a relocation can outweigh the broader market signal.
GRAI can bring those property-specific numbers into the same decision. A homeowner can compare selling now with renting for 12, 24 or 36 months, stress-test a lower achievable rent or weaker eventual sale price, and identify which assumptions have the greatest effect on the outcome.
Useful prompts include:
“Compare selling my Frisco home now with renting it for three years using my actual mortgage, taxes, insurance, HOA and achievable rent”
“Stress-test my property if rent falls 10%, vacancy reaches two months a year and the eventual sale price is 10% below today's estimate.”
For households considering relocation, another useful question is:
The dashboard provides the market layer. The property decision still needs the numbers for the actual home.
Ask GRAI to run your sell-versus-rent scenarios using your actual mortgage, taxes, and achievable rent: https://internationalreal.estate/chat
GRAI used US Department of Labor Office of Foreign Labor Certification LCA disclosure data and standardized the comparison to April 1 through June 30 in 2025 and 2026. The supplied FY2025 Q3 file contained the April-June quarter, while the FY2026 Q3 file was cumulative through June and therefore required a decision-date filter for a like-for-like comparison.
Markets were normalized by city and state before inclusion. A market qualified if it recorded at least 250 employer-declared H-1B new-employment positions in the 2025 baseline period, so no 2026 outcome could influence whether a city entered the analysis.
The final universe contains 89 markets representing 92,993 of the 163,567 national baseline positions, or 56.9%. The dashboard uses the current-status Certified population and excludes Certified-Withdrawn records from the headline measure.
Research by GRAI | Dataset 2026-09-05-v1 | Source: US Department of Labor, OFLC
Not automatically. A local housing effect would require employment changes to affect real households, alter buying, selling or renting behaviour, and be large enough that replacement demand does not offset the change.
No. An LCA is an employer filing and can cover multiple requested positions and multiple worksites. GRAI uses new-employment positions as an indicator of intended hiring activity, not as a count of unique people.
DFW recorded a 33.4% decline in employer-declared new-employment positions compared with 7.5% nationally, and all six predefined corridor cities declined. It is therefore a useful case study, although worksite attribution and employer concentration mean the figures should still be read directionally.
San Diego recorded the largest increase in the 89-market universe, rising 228.3% from a 2025 base of 893 positions. San Francisco, Cupertino, Mountain View and San Jose also recorded large gains, although very large city moves should be read alongside employer concentration.
No. The wage mix shifted in both growing and declining markets, and the DOL employment universe includes activity outside the cap-selection process. The weighted selection rule is one part of the policy backdrop, not a sufficient explanation for the full change.
No property decision should be made from that indicator alone. The useful analysis combines local market conditions with the homeowner's mortgage, equity, rent potential, transaction costs, tax position and likely relocation timeline.
Last updated: September 8, 2026


